
Our performance
Measuring our performance
To create sustainable economic value for our shareholders we focus on delivering growth and cash while maintaining appropriate capital. We aim to demonstrate how we generate profits under different accounting bases, reflecting the returns we generate on capital invested, and highlight the cash generation of our business.
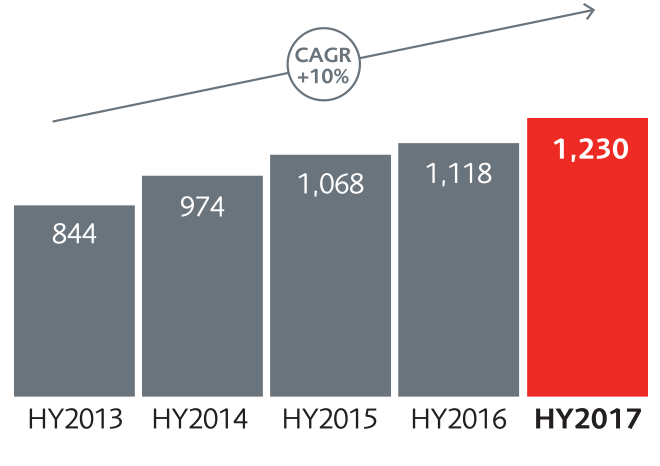
IFRS operating profit based on longer-term investment returns2,3 (£m)
What we measure and why
The Group’s business involves entering into long-term contracts with customers, and hence the Group manages its associated assets and liabilities over a longer-term time horizon. This enables the Group to manage a degree of short-term market volatility. Therefore, IFRS operating profit based on longer-term investment returns gives a more relevant measure of the performance of the business. Other items are excluded from IFRS operating profit to allow more relevant period on period comparisons of the trading operations of the Group, eg the effects of material corporate transactions are excluded.
Performance1
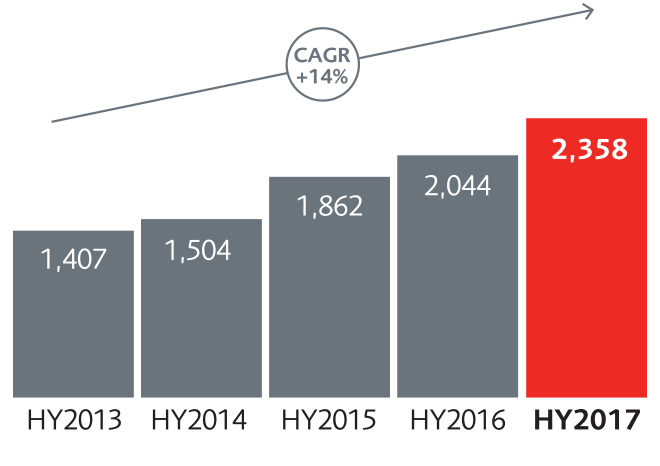
Group IFRS operating profit was 5 per cent higher on a constant currency basis (up 15 per cent on an actual exchange rate basis). The Group’s performance was driven by our Asia life and asset management operations which saw IFRS operating profit increase 16 per cent (up 31 per cent on an actual exchange rate basis) on growth in the in-force portfolio. In the US, total IFRS operating profit was up 8 per cent (up 22 per cent on an actual exchange rate basis). In the UK, IFRS operating profit from our insurance and asset management operations increased by 4 per cent11.
EEV new business profit3,4 (£m)
What we measure and why
Life insurance products are, by their nature, long-term and generate profit over a number of years. Embedded value reporting provides investors with a measure of the future profit streams of the Group. EEV new business profit reflects the value of future profit streams which are not fully captured in the period of sale under IFRS reporting.
Performance1
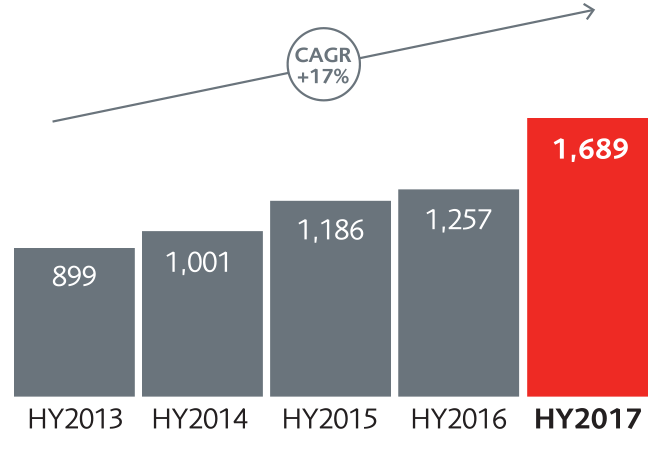
EEV new business profit was 20 per cent higher (up 34 per cent on an actual exchange rate basis), reflecting higher sales volumes and more favourable economics.
EEV operating profit3,4 (£m)
What we measure and why
EEV operating profit is provided as an additional measure of profitability. This measure includes EEV new business profit, the change in the value of Group’s long-term in-force business, and profit from our asset management and other businesses. As with IFRS, EEV operating profit reflects the underlying results based on longer-term investment returns.
Performance1
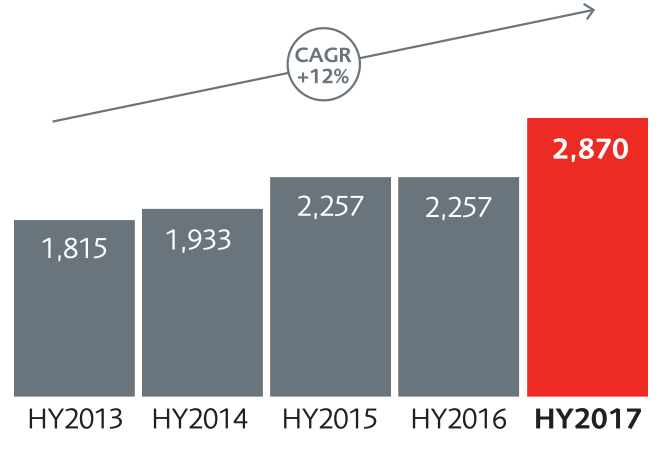
Group EEV operating profit based on longer-term investment returns was 15 per cent higher (27 per cent on an actual exchange rate basis), reflecting higher new business profits and the growth in profits from our in-force business.
Group free surplus generation3,5 (£m)
What we measure and why
Free surplus generation is used to measure the internal cash generation of our business units. For insurance operations it represents amounts maturing from the in-force business during the period less investment in new business and excludes other non-operating items. For asset management it equates to post-tax IFRS operating profit for the period.
Performance1
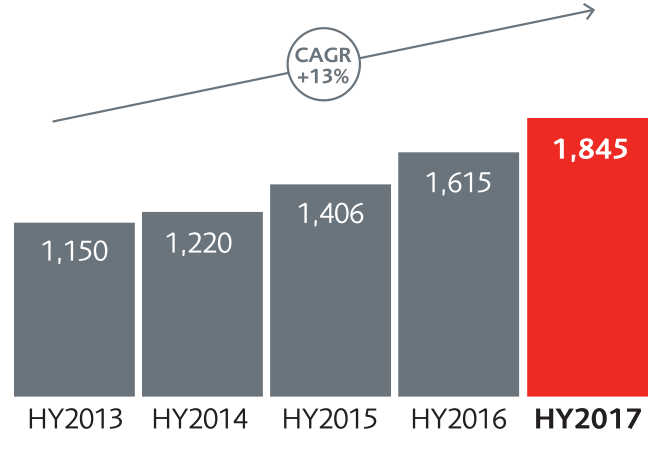
Underlying free surplus generation increased by 6 per cent on a constant currency basis (up 14 per cent on an actual exchange rate basis), reflecting a higher contribution from our growing in-force book of business and continued discipline of focusing on high-return new business with fast payback periods.
Business unit remittances6 (£m)
What we measure and why
Remittances measure the cash transferred from business units to the Group. Cash flows across the Group reflect our aim of achieving a balance between ensuring sufficient net remittances from business units to cover the dividend (after corporate costs) and the use of cash for reinvestment in profitable opportunities available to the Group.
Performance1
Cash remittances from our business units to the Group increased by 10 per cent compared to 2016, with well-balanced contributions across all of our geographic regions.
Group Solvency II capital surplus7,10 (£bn)
What we measure and why
Prudential is subject to the risk-sensitive solvency framework required under European Solvency II Directives (Solvency II) as implemented by the Prudential Regulation Authority in the UK. The Solvency II surplus represents the aggregated capital (own funds) held by the Group, less solvency capital requirements.
Performance1
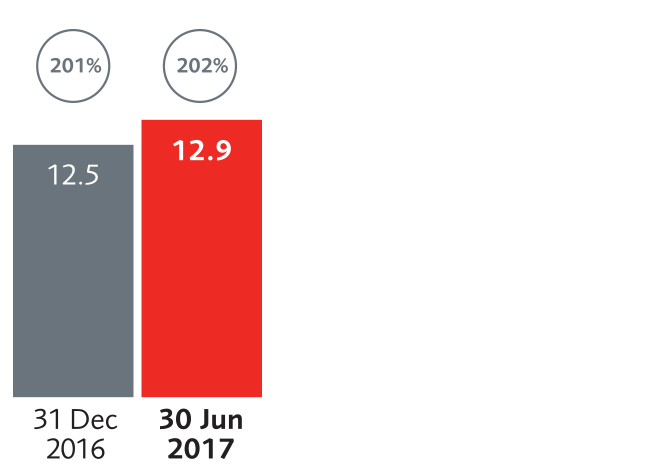
The high quality and recurring nature of our operating capital generation and our disciplined approach to managing balance sheet risk has resulted in the Group’s shareholders’ Solvency II capital surplus being estimated at £12.9 billion at 30 June 2017 (equivalent to a solvency ratio of 202 per cent) compared with £12.5 billion (201 per cent) at 31 December 2016.
Notes
- The comparative results shown above have been prepared using the actual exchange rates (AER) basis except where otherwise stated. Comparative results on a constant exchange rate (CER) basis are also shown in financial tables in the Chief Financial Officer’s report on the 2017 first half financial performance. CAGR is compound annual growth rate.
- IFRS operating profit is management’s primary measure of profitability and provides an underlying operating result based on longer-term investment returns and excludes non-operating items. Further information on its definition and reconciliation to profit for the period is set out in note B1 of the IFRS financial statements.
- Following its sale in May 2017, the operating results exclude the contribution of the Korea life business. All comparative results have been similarly adjusted. The relevant 2017 objective (Asia IFRS operating profit) has been adjusted.
- Embedded value reporting provides investors with a measure of the future profit streams of the Group. The EEV basis results have been prepared in accordance with EEV Principles discussed in note 1 of the EEV basis results. A reconciliation between IFRS and the EEV shareholder funds is included in note II(f) of the Additional financial information.
- Underlying free surplus generated comprises underlying free surplus generated from the Group’s long-term business (net of investment in new business) and that generated from asset management operations. Further information is set out in note 10 of the EEV basis results.
- Cash remitted to the Group forms part of the net cash flows of the holding company. A full holding company cash flow is set out in note II(a) of Additional financial information. This differs from the IFRS consolidated statement of cash flows which includes all cash flows relating to both policyholders and shareholders’ funds. The holding company cash flow is therefore a more meaningful indicator of the Group’s central liquidity.
- Estimated before allowing for first interim dividend.
- The objectives assume exchange rate at December 2013 and economic assumptions made by Prudential in calculating EEV basis supplementary information for the half year objectives ended 30 June 2013, and are based on regulatory and solvency regimes applicable across the Group at the time the objectives were set. The objectives assume the existing EEV, IFRS and free surplus methodology at December 2013 will be applicable over the period.
- Constant exchange rates results translated using exchange rates at December 2013.
- The Group shareholder capital position excludes the contribution to own funds and the solvency capital requirement from ring-fenced with-profits funds and staff pension schemes in surplus. The solvency positions include management’s estimate of transitional measures reflecting operating and market conditions at the valuation date. The estimated Group shareholder surplus would increase from £12.9 billion to £13.6 billion at 30 June 2017 if the approved regulatory transitional amount was applied instead.
- Includes UK life insurance and M&G.