Chief Financial Officer’s report on the
2017 first half financial performance
Strong progress against
our performance metrics

The consistency of our performance is driven by the alignment of our business to the most attractive opportunities, the quality of our franchises in those markets and our ability to adapt with speed and agility to changes in economic and regulatory conditions.
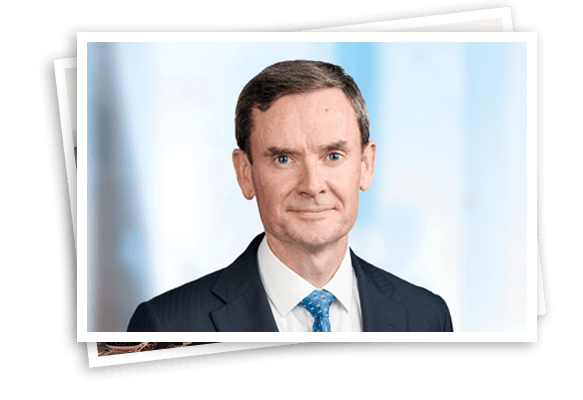
Mark FitzPatrick
Chief Financial Officer
Prudential has made a good start to 2017, with increases in all of our key performance metrics, reflecting progression in the Group’s underlying earnings drivers, together with the beneficial impact of positive investment market conditions and favourable currency effects. The consistency of our performance is driven by the alignment of our business to the most attractive opportunities, the quality of our franchises in those markets and our ability to adapt with speed and agility to changes in economic and regulatory conditions, both globally and locally. At a Group level, our results benefit from diversification by geography, product and distribution channel, our focus on recurring income streams that are less exposed to market movements and the capital generative nature of our business model.
In Asia, we have achieved double-digit growth in both IFRS operating profit and free surplus generation, reflecting the increasing scale and diversification of our long-term recurring premium business.
We continue to take decisive actions to preserve the quality of the business that we write, building the contribution from health and protection income and improving the overall economic returns of the new business portfolio.
In the US and the UK, our financial progress is underpinned by the accumulation of assets on which we earn fees. In each of these markets, our businesses have seen strong net inflows in the first half, demonstrating their competitive positioning in product, distribution and service capabilities. Asset values were also boosted by positive investment market movements in the period.
With Group operating free surplus generation of £1.8 billion in the first half of 2017, the Group has reported cumulative underlying free surplus generation of £11.1 billion since 2014, achieving our objective of generating over £10 billion of Group cumulative free surplus between 1 January 2014 and 31 December 2017 six months early. We remain on track to achieve the remaining Asia-focused objectives by the end of this year.
Despite the uncertainty caused by the outcome of the general election in the UK, sterling has strengthened slightly against most of the currencies in our major international markets since the beginning of the year. However, average sterling exchange rates in the first half of 2017 were significantly lower than in the same period in 2016, contributing to a positive effect on the translation of results from our non-sterling operations. To aid comparison of underlying progress, we continue to express and comment on the performance trends of our Asia and US operations on a constant currency basis.
The key operational highlights in the first half of 2017 were as follows:
- New business profit was 20 per cent1 higher at £1,689 million (up 34 per cent on an actual exchange rate basis), reflecting higher sales volumes and more favourable economics. Strong growth in new business profit was achieved across our life businesses in Asia, the US and the UK which were up 18 per cent1, 23 per cent and 29 per cent respectively.
- IFRS operating profit based on longer-term investment returns was 5 per cent1 higher at £2,358 million (up 15 per cent on an actual exchange rate basis), equivalent to an annualised 24 per cent2 return on opening IFRS shareholders’ funds. The Group’s performance was driven by our Asia life and asset management operations which saw IFRS operating profit increase 16 per cent1 to £953 million on growth in the in-force portfolio. In the US, total IFRS operating profit was up 8 per cent, driven by increased levels of fee income on higher separate account balances. In the UK, IFRS operating profit from our insurance and asset management operations increased by 4 per cent3, due to stronger contributions from management actions in the life business and higher assets under management at M&G.
- Underlying free surplus generation4, our preferred measure of cash generation from our life and asset management businesses, increased by 6 per cent1 to £1,845 million after financing new business growth, reflecting a higher contribution from our growing in-force book of business and continued discipline of focusing on high-return new business with fast payback periods. On an actual exchange rate basis the growth in this measure was 14 per cent.
- Group shareholders’ Solvency II capital surplus was estimated at £12.9 billion5,6 at 30 June 2017, equivalent to a cover ratio of 202 per cent (31 December 2016: £12.5 billion, 201 per cent). The movement since the start of the year primarily reflects the Group’s continuing strong operating capital generation, partially offset by the payment of the 2016 second interim dividend.
Investment markets have been generally supportive through the period, with equity markets trending upwards and more stability in bond and currency markets compared with 2016. The recovery in equity markets towards the end of 2016 has continued into 2017, with the S&P 500 index up 8 per cent and the FTSE 100 index gaining 2 per cent in the first six months. Longer-term yields at 30 June 2017 were almost unchanged from those at the start of the year in the UK, and down slightly in the US. In Asia, where yield movements have been more pronounced, our IFRS operating earnings are largely insensitive to interest rates. Overall, we continue to reduce the sensitivity of our earnings and balance sheet to investment markets, but remain significant long-term holders of financial assets to back the commitments that we have made to our customers. Short-term fluctuations in both these assets and related liabilities are reported outside the operating result, which is based on longer-term investment return assumptions. In the first half of 2017, these short-term fluctuations were overall negative, driven by the effect of higher equity markets on our hedging programme in the US. In the first half of the year, total IFRS post-tax profit was up at £1,505 million (2016: £720 million on a constant exchange rate basis) and total EEV after-tax profit was also higher at £3,297 million (2016: £1,506 million on a constant exchange rate basis).
Reflecting the strong operating results, the Group’s IFRS shareholders’ equity increased by 5 per cent7 over the six month period to £15.4 billion (31 December 2016: £14.7 billion), with the Group’s EEV basis shareholders’ equity up 4 per cent7 to £40.5 billion (31 December 2016: £39.0 billion).
Notes
- Following its sale in May 2017, the operating results exclude the contribution of the Korea life business. All comparative results have been similarly adjusted.
- Annualised operating profit after tax and non-controlling interests as percentage of opening shareholders’ funds.
- Includes UK life insurance and M&G.
- Free surplus generation represents ‘underlying free surplus’ based on operating movements, including the general insurance commission earned during the period and excludes market movements, foreign exchange, capital movements, shareholders’ other income and expenditure and centrally arising restructuring and Solvency II implementation costs.
- Before allowing for first interim dividend.
- The Group shareholder capital position excludes the contribution to own funds and the solvency capital requirement from ring-fenced with-profits funds and staff pension schemes in surplus. The solvency positions include management’s estimate of transitional measures reflecting operating and market conditions at the valuation date. The estimated Group shareholder surplus would increase from £12.9 billion to £13.6 billion at 30 June 2017 if the approved regulatory transitional amount was applied instead.
- Comparable to 31 December 2016 on an actual exchange rate basis.
- Refer to note B1.1 in IFRS financial statements for the breakdown of other income and expenditure and other non-operating items.
- Operating income comprises spread income, fee income, with-profits, insurance margin and expected shareholder return.
- Includes Group’s proportionate share of the liabilities and associated flows of the insurance joint ventures and associate in Asia.
- Defined as movements in shareholder-backed policyholder liabilities arising from premiums (net of charges), surrenders/withdrawals, maturities and deaths.
- Following its sale in May 2017, the shareholder-backed policyholder liabilities and related flows for Asia exclude the value for the Korea life business. The half year 2016 comparatives have been adjusted accordingly.
- Includes unallocated surplus of with-profits business.
- For basis of preparation see note I(a) of Additional financial information.
- Includes Group’s proportionate share in PPM South Africa and the Asia asset management joint ventures.
- For our asset management business the level of funds managed on behalf of third parties, which are not therefore recorded on the balance sheet, is a driver of profitability. We therefore analyse the movement in the funds under management each period, focusing between those which are external to the Group and those held by the insurance business and included on the Group balance sheet. This is analysed in note II(b) of the Additional financial information.
- Net inflows exclude Asia Money Market Fund (MMF) inflows of £499 million (2016: net inflows £656 million on an actual exchange rate basis). External funds under management exclude Asia MMF balances of £8,327 million (2016: £7,421 million on an actual exchange rate basis).
- ©2017 Morningstar, Inc. All Rights Reserved. The information contained herein: (1) is proprietary to Morningstar and/or its content providers; (2) may not be copied or distributed; and (3) is not warranted to be accurate, complete or timely. Neither Morningstar nor its content providers are responsible for any damages or losses arising from any use of this information. Past performance is no guarantee of future results. 1Q 2017 Morningstar VA Report with Commentary.
- Net cash remitted by business units included in the Holding company cash flow is disclosed in note II(a) of Additional financial information.
- Refer to the EEV basis supplementary information – Post-tax operating profit based on longer-term investment returns and Post-tax summarised consolidated income statement for the breakdown of other income and expenditure and other non-operating items.
- The methodology and assumptions used in calculating the Solvency II capital results are set out in note II(c) of Additional financial information.
- The UK shareholder capital position excludes the contribution to own funds and the solvency capital requirement from ring-fenced with-profits funds and staff pension schemes in surplus. The solvency positions include management’s estimate of transitional measures reflecting operating and market conditions at the valuation date. The estimated UK shareholder surplus would increase from £5.3 billion to £6.0 billion at 30 June 2017 if the approved regulatory transitional amount was applied instead.
- The UK with-profits Solvency II surplus includes the PAC with-profits sub-fund, the Scottish Amicable Insurance Fund and the Defined Charge Participating Sub-Fund. The estimated solvency position allows for management’s estimate of transitional measures reflecting operating and market conditions at the valuation date.
- Net of related changes to deferred acquisition costs and tax.


